GIS Emergency Management: 11 Critical Uses in 2025
Emergency management today is defined by data. Every disaster generates vast volumes of geographic, infrastructure, and population information that must be analyzed instantly to support lifesaving decisions.
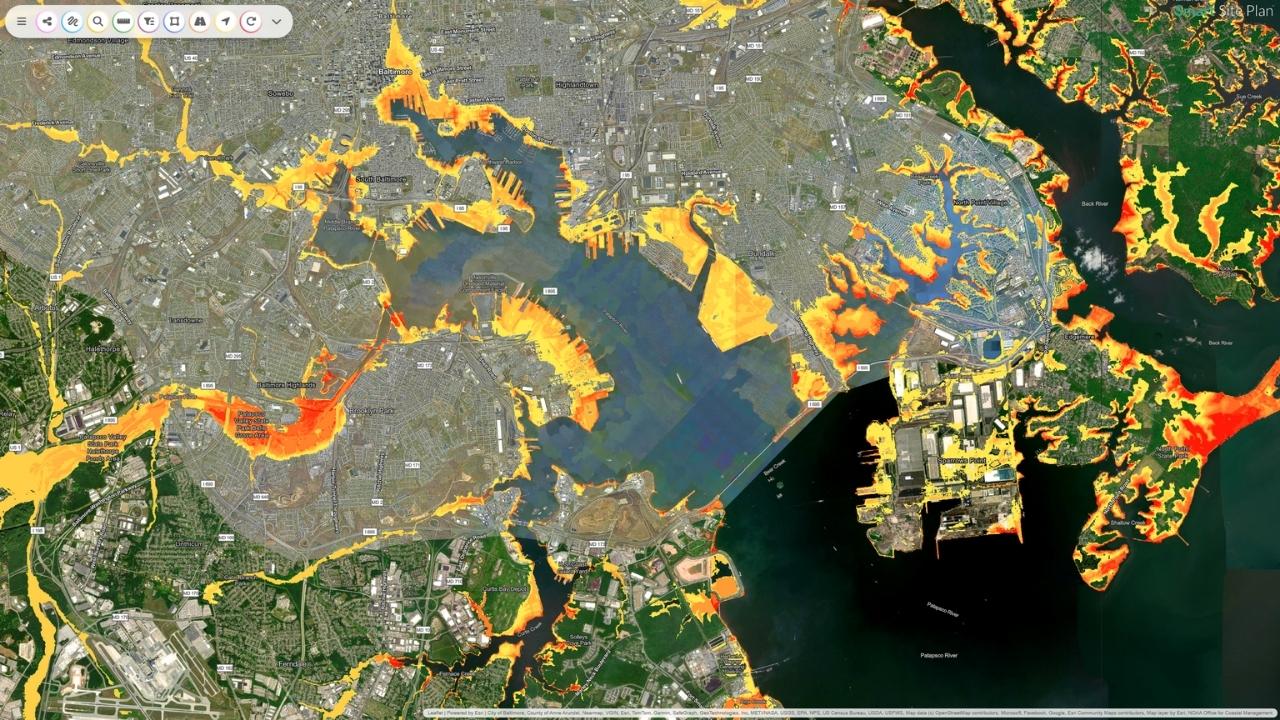
Emergency management today is defined by data. Every disaster generates vast volumes of geographic, infrastructure, and population information that must be analyzed instantly to support lifesaving decisions. According to NOAA, the United States experienced 28 separate billion-dollar weather and climate disasters in 2023, the highest number ever recorded, reflecting the escalating complexity and scale of emergency response nationwide. GIS in emergency management uses geospatial information to support planning, response, and recovery efforts. By layering hazard data, infrastructure, population vulnerability, and real-time feeds, GIS transforms complex information into clear visual insights, enabling better planning, faster response, and smarter recovery.
Key Takeaways
- Multi-hazard mapping: GIS enables communities to map floodplains, seismic zones, wildfire perimeters, surge areas, and more, forming the foundation of resilient planning
- Vulnerability analysis: layering social vulnerability, critical infrastructure, and population density reveals where a disaster could hit hardest
- Real-time situational awareness: live dashboards and geospatial overlays give response teams visibility into impacted areas, blocked roads, and resource needs
- Mobile field reporting: geo-tagged photos, damage reports, and status logs give decision-makers up-to-date ground-level visibility
- Evacuation route planning: spatial analysis of road networks and hazard zones enables communities to design optimal evacuation paths before an event
- Damage assessment: post-event GIS mapping documents damage at the parcel level, accelerating FEMA PA and IA applications
- Debris management: geo-tagged debris reports and load tracking help public works teams prioritize routes and document FEMA reimbursement
What Is GIS Emergency Management, And Why It Matters
Studies show that GIS-based modeling supports hazard analysis, vulnerability assessment, risk mapping, damage assessment, and disaster response planning across hazards such as floods, earthquakes, hurricanes, and wildfires.
In practice, GIS helps emergency teams anticipate threats, allocate resources, coordinate operations, and monitor progress, converting geographic information into actionable intelligence.
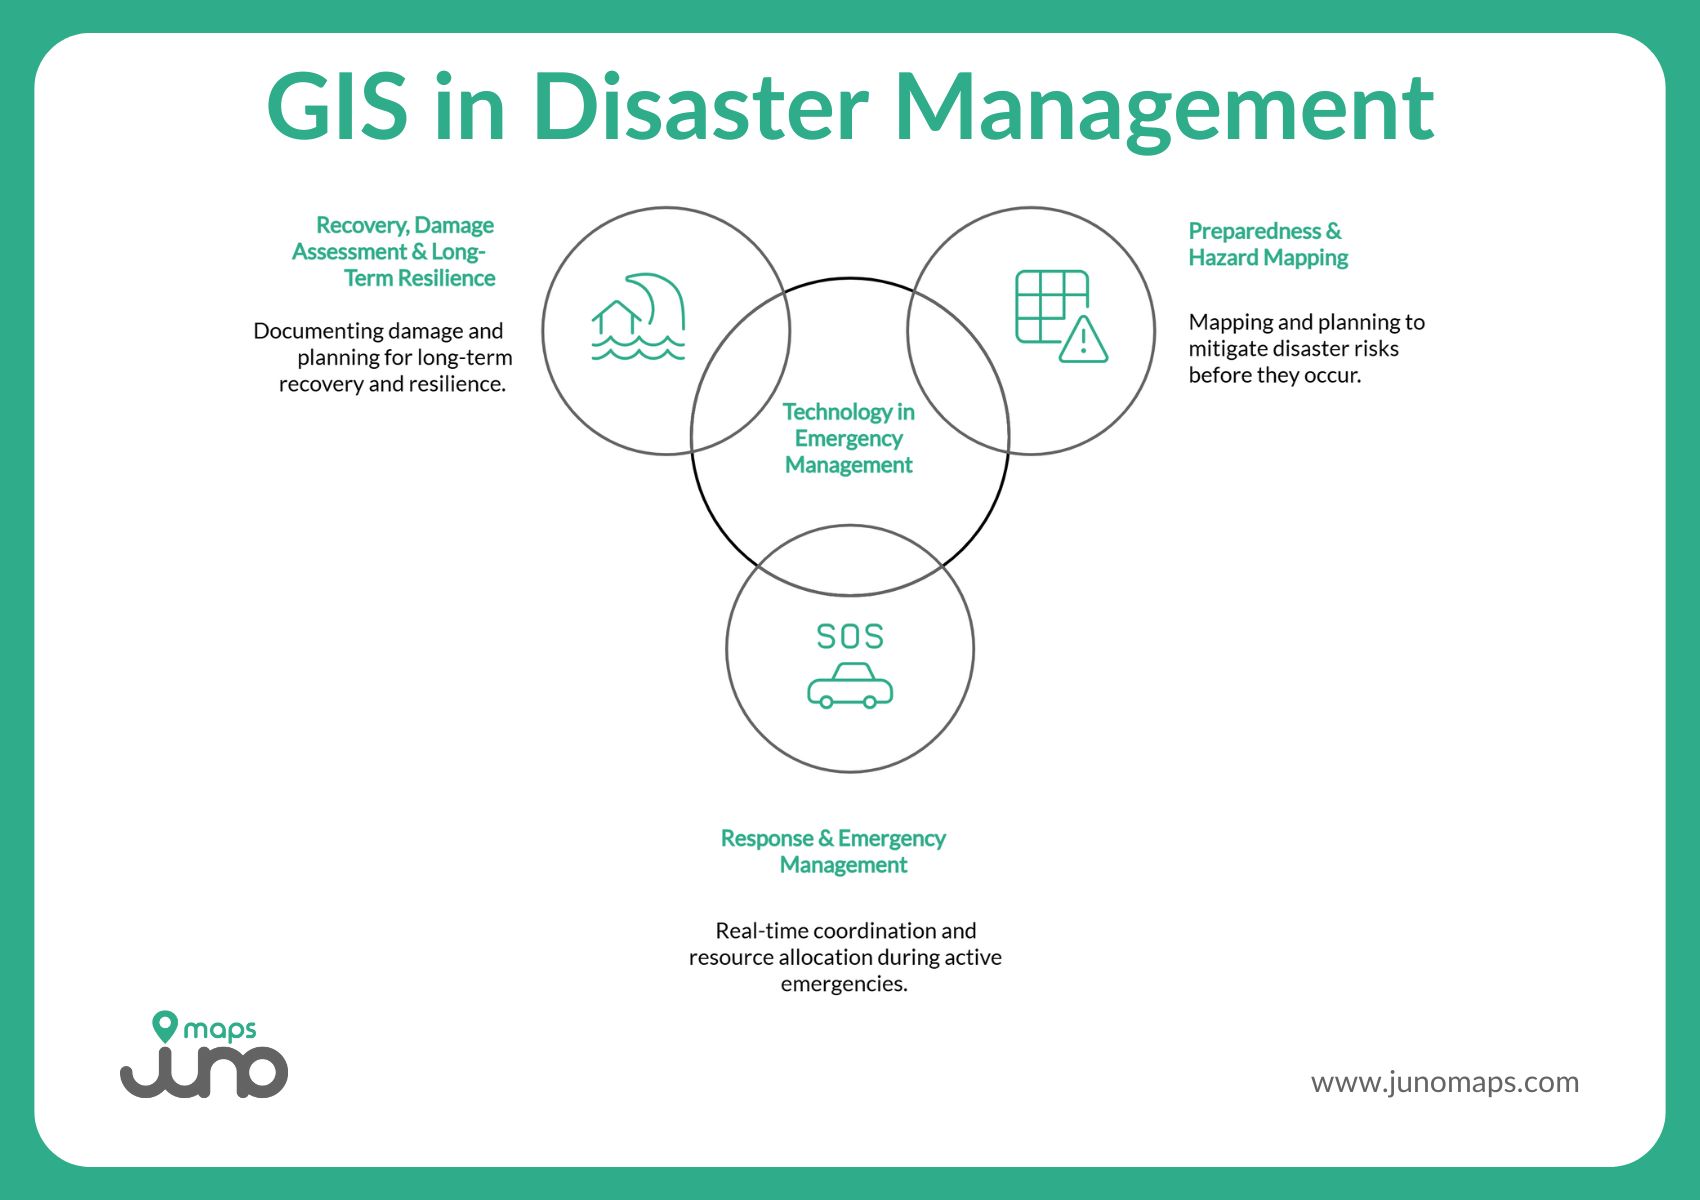
Technology in Emergency Management: GIS Across the Disaster Lifecycle:
Disaster management isn’t defined by a single moment in time; it is a continuous cycle requiring foresight, rapid adaptation, and long-term coordination. GIS supports every phase of this lifecycle, providing the geospatial insight needed to anticipate hazards before they occur, guide real-time decisions during active emergencies, and inform rebuilding and mitigation efforts long after an incident ends.
Preparedness & Hazard Mapping
- Mapping multi-hazard exposure zones: GIS enables communities to map floodplains, seismic risk zones, wildfire perimeters, coastal surge areas, and more. This “map-based hazard inventory” becomes the foundation of resilient planning.
- Overlaying vulnerability and infrastructure layers: By layering social vulnerability, critical infrastructure (roads, utilities, hospitals), and population density, GIS supports a nuanced understanding of where a disaster could hit hardest.
- Supporting hazard mitigation planning: In the U.S., the Disaster Mitigation Act of 2000 (DMA 2000) and its implementing regulation 44 CFR Part 201 require state, local, and tribal governments to identify natural hazards, assess risks, and develop mitigation strategies to remain eligible for federal mitigation grants and disaster assistance.
- Integrating remote sensing, aerialimagery, and open data: Modern GIS emergency management leverages satellite imagery, drone/LiDAR data, open geospatial datasets, and census or infrastructure records to build a comprehensive risk profile.
GIS also directly supports FEMA’s Risk MAP (Risk Mapping, Assessment, and Planning) program, which provides data, modeling, mapping, and planning resources to help communities reduce flood risk and strengthen hazard mitigation efforts.
What does GIS stand for?
GIS stands for Geographic Information System, a technology used for data analysis and visualization of geography to support emergency and homeland security operations.
Response & Emergency Management
When disaster hits, GIS becomes an operational force multiplier:
- Real-time mapping and shared situational awareness: Live dashboards and geospatial overlays help response teams visualize impacted areas, blocked roads, flooded zones, damaged infrastructure, and resource needs. This data-driven map enables rapid, coordinated deployment.
- Mobile field reporting: Responders, inspectors, volunteers can upload geo-tagged photos, damage reports, needs assessments, and status logs, giving decision-makers up-to-date, ground-level visibility. GIS bridges remote sensing and on-the-ground intelligence.
- Efficient asset and resource allocation: GIS helps identify priority neighborhoods, critical infrastructure, evacuation routes, and shelter locations, optimizing response time and resource deployment under pressure.
- Support for complex disaster types, floods, fires, earthquakes, hurricanes: Across hazard types, GIS enables scenario planning, impact mapping, and rapid decision-making.
Recovery, Damage Assessment & Long-Term Resilience
After the emergency, GIS remains central to rebuilding and resilience:
- Parcel-level damage assessment and infrastructure mapping: GIS allows precise documentation of damage to buildings, utilities, roads, and natural features, critical for insurance, grant funding, and reconstruction.
- Tracking recovery progress and resilience building: From temporary repairs to long-term mitigation, GIS supports tracking, reporting, and planning of recovery projects, green-infrastructure investments, and infrastructure upgrades.
- Historical data archiving for future disasters: Maintaining a spatial archive of hazard events, impacts, response timelines, and recovery outcomes helps refine future hazard mitigation plans and supports compliance with frameworks such as DMA 2000 / 44 CFR Part 201.
By integrating data across preparedness, response, and recovery, GIS enables emergency managers to shift from reactive problem-solving to proactive, data-driven resilience.
How do GIS and emergency management work together?
GIS in emergency management uses geospatial information to support planning, response, and recovery efforts. It helps agencies mitigate risk, improve situational awareness, and coordinate operations across public safety, homeland security, and emergency response teams.
Why Traditional Approaches No Longer Suffice
Many communities still rely on static maps, fragmented spreadsheets, disconnected departments, and siloed datasets. Such outdated methods struggle under the increasing demands of multi-hazard disasters and complex infrastructure networks.
Limitations include:
- Slow sharing and delayed updates across agencies and departments
- Limited situational awareness: no single source of truth for hazard data, population vulnerability, infrastructure, or incident reports
- Fragmented documentation and manual processes: increasing risk of error, delay, or missing critical information
- Poor post-disaster data capture and weak institutional memory: making it difficult to learn, improve, or comply with future mitigation requirements
In short: reactive, manual systems cannot support modern disaster management needs.
Smart Site Plan by Juno Maps: GIS Emergency Management Made Practical
Smart Site Plan delivers geospatial, mobile-friendly, data-driven capabilities that align directly with the GIS needs of modern emergency management. Without requiring specialized GIS training, it empowers communities to implement GIS-based planning, response, and recovery workflows. Key features include:
- Multi-hazard mapping and infrastructure overlays, including hazard zones, critical infrastructure, population vulnerability, and more – supporting preparedness and risk assessment.
- Mobile-friendly field reporting, allowing responders, inspectors, and volunteers to upload geo-tagged photos, damage logs, and status updates directly into the platform for real-time situational awareness.
- Shared, cloud-based collaboration, eliminating fragmented spreadsheets and enabling cross-agency coordination and unified data views.
- Integrated data sources, combining CAD drawings, open data layers, remote sensing imagery, infrastructure inventories, and aerial data into one operational environment.
- Documentation and archival capabilities, enabling damage assessment, recovery tracking, after-action review, and long-term resilience planning.
By bridging geospatial data, operational coordination, and real-time response, Smart Site Plan helps emergency managers, even without dedicated GIS departments, implement robust GIS in disaster management across all phases: preparedness, response, and recovery.
How does GIS support mapping disaster events?
GIS supports mapping disaster events by integrating satellite imagery, remote sensing, and field reports to monitor damage and enhance planning. GIS can help responders prioritize actions and accelerate recovery for government, non-profit, and private sector partners.
GIS Is No Longer Optional in Emergency Management
In a world of increasing climate risk, urban growth, infrastructure complexity, and unpredictable disasters, from hurricanes and wildfires to floods and earthquakes, GIS is no longer a nice-to-have tool. It is the foundation of data-driven, coordinated, resilient emergency management.
Under U.S. frameworks such as the Disaster Mitigation Act of 2000 and 44 CFR Part 201, hazard mitigation planning is a regulatory requirement for communities seeking federal assistance. GIS enables those communities to do more than check compliance boxes; it empowers them to build real resilience.
If your jurisdiction wants to strengthen preparedness, streamline response, and accelerate recovery, now is the time to embrace GIS emergency management. Platforms like Smart Site Plan make it feasible, scalable, and effective for municipalities, utilities, public works, and emergency management agencies.
Act now. Invest in GIS technology, build smarter hazard maps, and give your community the tools to survive, respond, and recover. Learn more!
Ready to Put This Into Practice?
See how Juno Maps applies to your specific industry and use case.