Utility Line Maps for Emergency Response and Planning in 2026
Utility line maps sit at the center of how communities plan, build, and protect critical infrastructure. As underground systems age, regulations evolve, and expectations for transparency grow, agencies are being asked to manage utility data more accurately than ever.
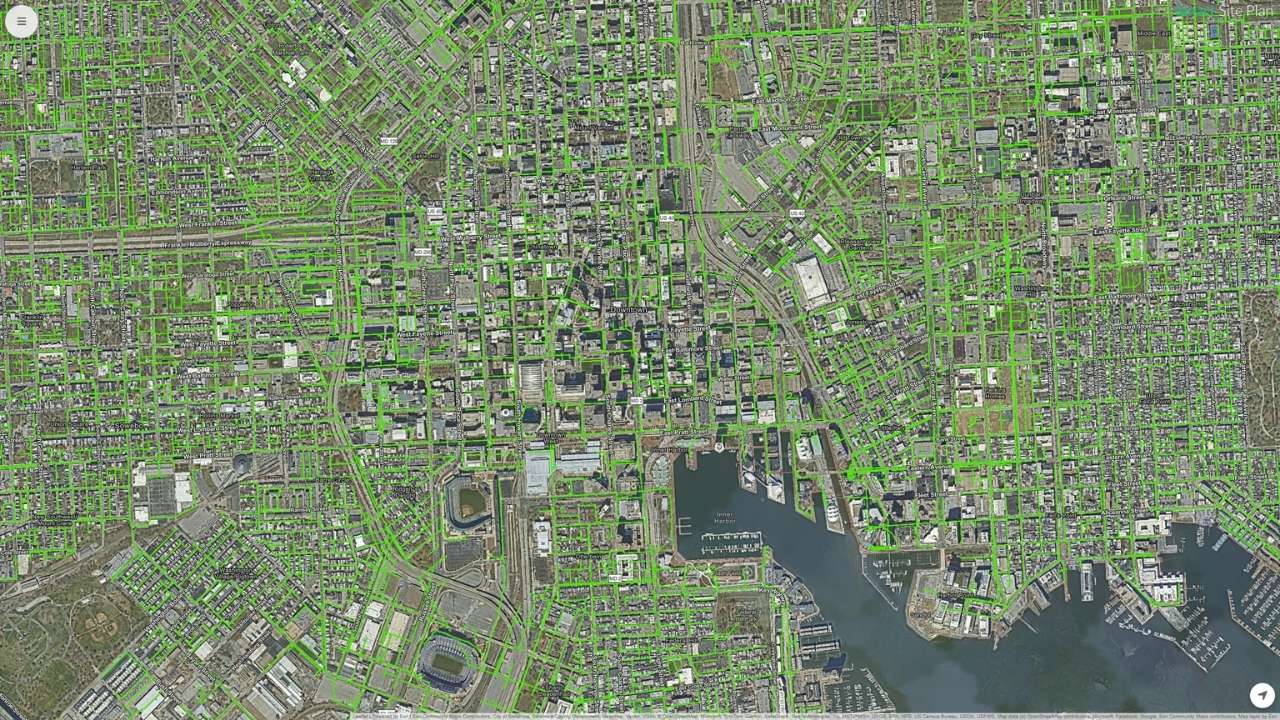
A utility line map is a geographic representation of underground infrastructure such as water, sewer, gas, electric, oil, and telecommunications lines. Used by public works departments, utilities, planners, and construction teams to understand where infrastructure exists and how it connects across a service area. The way agencies manage utility maps has changed dramatically over the past two decades: what was once paper plans and static files is now increasingly digital platforms that reflect how infrastructure work actually happens.
Key Takeaways
- Legacy records, including paper plats, scanned drawings, static PDFs, and disconnected CAD files, present real challenges when reused in modern workflows. The Federal Geographic Data Committee and U.S. Geological Survey provide standards and open datasets that help agencies modernize these records
- CAD drawings, GIS files, PDFs, images, and site plans can be viewed together in a georeferenced map, reducing search time and helping responders understand site conditions
- Built-in markups and comments allow teams to flag damaged areas, note temporary repairs, and share observations directly on the map, with updates syncing across users
- Georeferenced layers help teams understand what is underground, what is nearby, and how utilities intersect, supporting safer excavation and restoration planning
- Information added during an incident stays linked to the location for follow-up inspections and post-event review
- Layered utility maps give planners, field crews, and emergency responders a clearer, more reliable picture of what lies underground
- Modern web-based mapping applications help agencies view layered utility data alongside property and address information
What Is a Utility Line Map and Why It Matters Now
Typical Layers and Components in Utility Line Maps
Utility line maps work best when they bring multiple layers of information together in a clear, organized way. Each layer adds context, helping users understand not just where infrastructure is located, but how it relates to surrounding conditions, property, and operations.
Common layers found in utility line maps include:
- Utility networks: Water, sewer, stormwater, gas, electric, and telecommunications lines, often displayed separately so users can view one system or multiple systems at once.
- Service connections: Lines that connect main utilities to individual properties, including public and private service segments where available.
- Valves, hydrants, and access points: Key assets used for isolation, maintenance, and emergency response.
- Parcels and addresses: Property boundaries and address data that help link utilities to customers, buildings, and ownership records.
- Rights-of-way and easements: Information that shows where utilities are legally located and where access is permitted.
- Base map and reference layers: Streets, aerial imagery, and landmarks that provide geographic context and improve orientation.
- Supporting operational layers: Inspection notes, construction history, or planned projects that help teams understand past work and future needs.
Not every map includes all of these layers, and availability depends on data quality and agency priorities. Together, however, layered utility maps give planners, field crews, and emergency responders a clearer, more reliable picture of what lies underground and how systems connect across the service area.
How often are utility maps updated?
Update frequency varies by public service organization. Many utilities update maps after construction, inspections, or asset changes to meet operational and regulatory requirements.
Why Does a Map of Utility Lines Matter
Today, the purpose of a utility map extends well beyond internal reference. Utility line maps are now used to:
- Support infrastructure planning and capital investment decisions
- Reduce risk during construction and excavation
- Coordinate across departments and service providers
- Provide public information where required by law
Federal guidance increasingly recognizes geospatial infrastructure data as essential to responsible governance. The Federal Geographic Data Committee identifies transportation and other core geospatial data themes as key components of the National Spatial Data Infrastructure, supporting functions such as emergency response, environmental protection, and economic development.
From Paper to Platforms: The Modern Utility Line Mapping Tools
The way agencies manage utility maps has changed dramatically over the past two decades. What was once handled through paper plans and static files is now increasingly supported by digital platforms that reflect how infrastructure work actually happens across planning, construction, and public service.
Underground Utility Lines Map Realities: Legacy Records vs Current Needs
Many underground utility line maps still originate from legacy records. These may include paper plats, scanned drawings, static PDFs, or disconnected CAD files stored across departments. While these records are often the best available documentation for older infrastructure, they present real challenges when reused in modern workflows.
Common legacy issues include:
- Line locations derived from historical plats or construction drawings, not field-verified surveys
- Mixed format quality, where CAD, GIS data, and scanned documents coexist without alignment
- Records created before consistent coordinate systems or modern geographic information system standards
As a result, many utility maps show approximate locations rather than precise positions.
Accurate Utility Map Expectations in Planning and Construction
Accuracy expectations depend on how the map is used. For planning and early development, approximate utility locations may be sufficient to evaluate feasibility for commercial buildings or infrastructure projects. Field execution, however, requires higher confidence to safely locate assets and coordinate construction.
Modern web-based mapping applications help agencies:
- View layered utility data alongside property and address information
- Search and display records by location
- Link surveys, documentation, and updates to mapped features
By aligning utility maps with real workflows and clearly communicating accuracy, agencies can reuse legacy records responsibly while supporting safer, more efficient infrastructure management.
GIS, Data, and the Move Toward Better Infrastructure Management
As infrastructure systems grow more complex and expectations for accuracy increase, Geographic Information Systems have become central to how utilities manage, share, and use information.
The U.S. Geological Survey emphasizes that geospatial data and spatial context are critical for understanding how infrastructure, hazards, and landscapes interact during emergencies and for supporting operational decision‑making.
GIS does not replace operational expertise. It provides the spatial framework that helps agencies coordinate work, meet requirements, and communicate clearly with users inside and outside the organization.
Spatial Context for Real-world Decisions
GIS allows utility lines to be viewed alongside parcels, rights-of-way, easements, and other assets. This spatial context helps staff understand how infrastructure relates to property boundaries, addresses, and public space, which is essential for planning, permitting, and construction coordination.
What are the benefits of using utility maps?
Utility maps help managers plan work, protect property, coordinate response, and reduce risk for both residential and commercial areas.
Linking Attributes to Location
A GIS-based utility map connects asset attributes to geometry, allowing users to see not just where a line is, but what it is. Common attributes include:
- Material type
- Installation era
- Condition or inspection status
Linking these attributes to mapped features supports maintenance planning and helps agencies prioritize work across the network.
Shared Location Context Across Departments
Because GIS provides a common location reference, it supports coordination across utilities and departments. Planning, public works, engineering, and emergency response teams can work from the same geographic view, even if they use different tools or workflows. This shared context reduces miscommunication and supports more consistent decision-making across the organization.
Authoritative Systems as the System of Record
Most utilities maintain an authoritative GIS or CMMS as the system of record. These systems:
- Store official utility data
- Enforce editing rules and standards
- Support legal, technical, and regulatory requirements
Edits to authoritative systems are typically limited to trained users to protect data completeness and accuracy.
Viewer and Collaboration Tools as the System of Engagement
Map viewers and web-based collaboration tools serve a different purpose. They allow a broader group of users to:
- View utility information without specialized software
- Aggregate data from multiple sources into a single view
- Share maps for informational and coordination purposes
These tools improve access and communication while preserving the integrity of authoritative data. By defining roles, responsibilities, and tool purpose, agencies can use modern technology to improve infrastructure management without compromising trust or data quality.
Who uses utility maps?
Utility maps are used by public agencies, commercial developers, inspectors, emergency responders, and infrastructure managers.
Regulatory and Operational Drivers Shaping Utility Mapping
Across the U.S., utilities face growing expectations to document, maintain, and share infrastructure information. While regulations may not always specify a particular mapping tool, they often create a clear requirement for reliable, well-documented utility data.
Key drivers include:
- Regulatory and reporting obligations tied to public safety, environmental protection, and infrastructure oversight
- Right-to-know pressures, where communities expect access to certain utility information, especially when service disruptions or hazards occur
- The operational need to provide data quickly to internal departments, consultants, emergency responders, and external partners
During an emergency, delays caused by inaccessible or fragmented records can directly affect response time. As a result, agencies increasingly rely on centralized, map-based systems that allow teams to find and share information quickly, without exposing sensitive details that could create security risks.
From Planning to Response: Where Smart Site Plan Adds Value
As agencies work to improve how they manage and share utility maps, many are looking for practical ways to make existing data easier to access during time-sensitive situations, especially emergency response. This is where Smart Site Plan from Juno Maps fits into the broader infrastructure management landscape.
Smart Site Plan provides a web-based, geospatial environment that brings existing utility data into a single, shared view. Rather than replacing authoritative GIS or asset management systems, it helps teams engage with the data they already maintain during high-pressure situations.
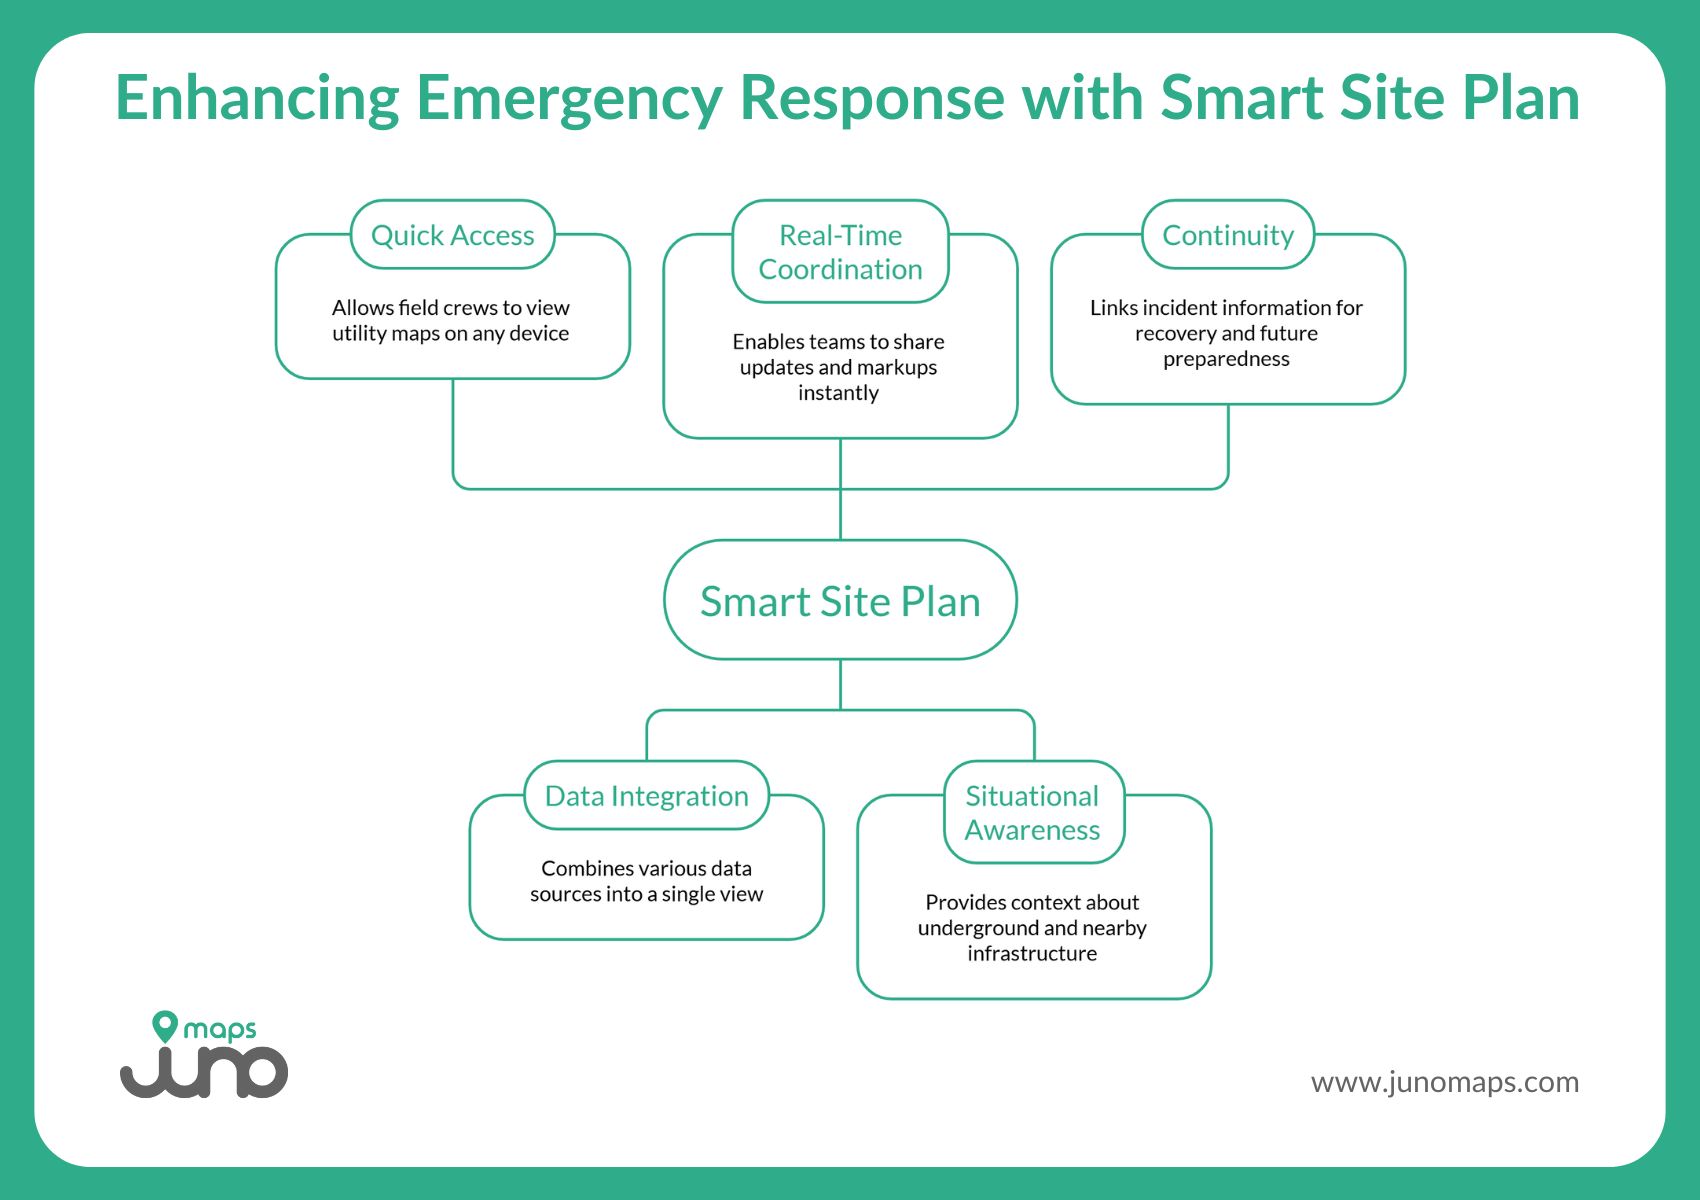
During crisis and emergency response, Smart Site Plan supports utility mapping by enabling teams to:
Access Utility Maps Quickly from Any Location
Field crews, supervisors, and emergency managers can view utility line maps on any internet-capable device, without needing specialized GIS software. This helps ensure everyone is working from the same information, even when teams are distributed.
Bring Multiple Data Sources Together in One View
CAD drawings, GIS files, PDFs, images, and site plans can be viewed together in a georeferenced map. This reduces time spent searching for records and helps responders understand site conditions and surrounding infrastructure.
Coordinate in Real Time as Conditions Change
Built-in markups and comments allow teams to flag damaged areas, note temporary repairs, or share observations directly on the map. Updates sync across users, improving coordination and reducing confusion.
Improve Situational Awareness and Safety
Georeferenced layers help teams understand what is underground, what is nearby, and how different utilities intersect. This context supports safer excavation, isolation of affected areas, and restoration planning.
Maintain Continuity from Response to Recovery
Information added during an incident can remain linked to the location for follow-up inspections, documentation, and post-event review, supporting stronger recovery and future preparedness.
By focusing on access, visibility, and collaboration, Smart Site Plan helps turn utility maps into shared, actionable resources during emergencies. For agencies responsible for protecting infrastructure and public safety, it offers a practical way to improve response readiness without changing existing systems or data governance.
From Utility Maps to Better Infrastructure Decisions
Utility line maps are no longer just reference drawings. They are critical infrastructure data that support public safety, emergency response, planning, and public trust.
As communities face increasing pressure to do more with limited resources, the ability to access, understand, and share utility data becomes a defining factor in infrastructure resilience.
Smart Site Plan helps agencies move beyond static utility maps by making geospatial information easier to use in real-world situations. To learn more about how Smart Site Plan can support your utility mapping and emergency response needs, connect with us today.
Ready to Put This Into Practice?
See how Juno Maps applies to your specific industry and use case.