Natural Disaster Map: 5 Powerful Lessons from Real Events
Natural disasters rarely arrive without warning, but they often strike communities that lack clear, connected information when it matters most. Better preparation reduces damage, confusion, and recovery time.
Natural disasters rarely arrive without warning, but they often strike communities that lack clear, connected information when it matters most. Wildfires, floods, hurricanes, and tornadoes don't just damage infrastructure: they displace families, disrupt essential services, and reshape entire regions for years. Better preparation does not prevent disasters, but it does reduce damage, confusion, and recovery time. Today, many communities are turning to geospatial data, parcel-level insight, and real-time mapping tools to better understand risk before an event occurs.
Key Takeaways
- A map of US natural disasters reveals patterns of repeated exposure, showing where impacts are most likely to occur again and influencing infrastructure, emergency services, and neighborhood-level risk
- The 2025 California wildfires near Los Angeles caused an estimated $250 billion in damage and destroyed more than 16,000 structures, underscoring the importance of parcel-level mapping and hazard overlays
- Hurricane Katrina revealed the devastating consequences of disconnected infrastructure data and limited situational awareness: floodplain mapping and infrastructure inventories are now central to modern emergency planning
- Hurricane Harvey demonstrated that flood risk is not static: communities need dynamic mapping tools that combine infrastructure and real-time data to understand changing conditions
- Preparedness depends on how well information is shared and used before an event occurs: communities with clear, connected data are better positioned to respond quickly and coordinate across teams
A Map of US Natural Disasters Shows Where Risk Repeats
These patterns matter. They influence where infrastructure is built, how emergency services are deployed, and which neighborhoods face compounding risk. A visual map helps move disaster planning from hindsight to foresight by showing where impacts are most likely to occur again.
Why US Natural Disaster Maps Matter for Planning
For planners, emergency managers, and public agencies, this perspective is essential. A map makes it easier to see patterns that aren’t obvious in reports or spreadsheets, such as clusters of flooding along river corridors, wildfire risk near expanding development, or storm impacts concentrated along vulnerable infrastructure.
US natural disaster maps support better planning by helping communities:
- Identify high-risk areas before the next event occurs
- Prioritize mitigation efforts and infrastructure investments
- Coordinate response planning across departments and jurisdictions
- Understand how land use and development intersect with known hazards
Most importantly, these maps help shift planning from reactive to proactive. When communities understand where disasters have occurred and how often they repeat, they can make more informed decisions about preparedness, response strategies, and long-term resilience.
Disasters That Changed Communities and What They Teach Us About Preparedness
Natural disasters leave lasting marks on the communities they touch. Beyond the immediate damage, they reshape neighborhoods, strain public systems, and test how prepared cities truly are when conditions change suddenly. From wildfires and floods to hurricanes and tornadoes, these events reveal vulnerabilities that often go unnoticed until it’s too late.
Looking back at major disasters across the United States, one lesson stands out: preparation matters. Communities with clear information, coordinated planning, and a shared understanding of risk are better positioned to respond, recover, and rebuild. Those without it face longer recovery timelines and greater disruption to everyday life.The disasters highlighted below are not just historical events. They are case studies in how risk, infrastructure, and decision-making intersect, and how better visibility and planning can help communities reduce impact before the next disaster strikes.
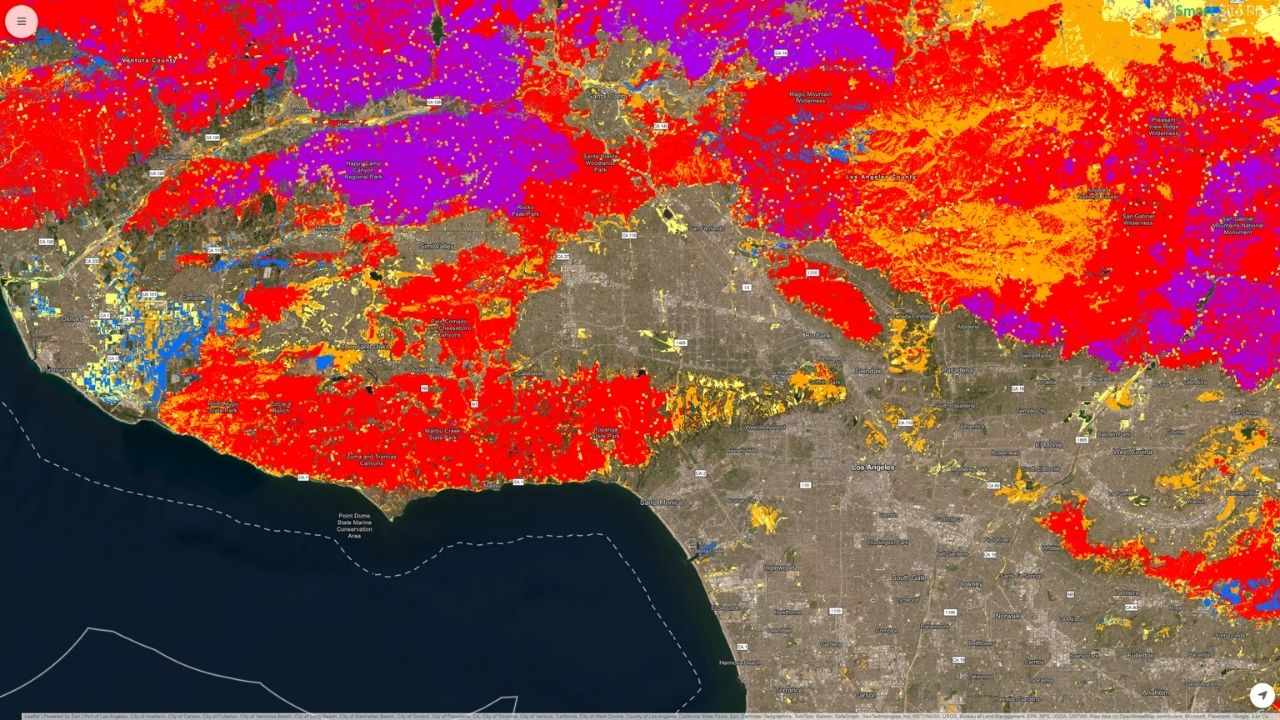
California Fire – Los Angeles, CA, USA – 2025
Interactive Map – Wildfire Threat Zones near Los Angeles, CA – View Full Map
The 2025 California wildfires near Los Angeles becameone of the most destructive fire events in U.S. history. Driven by extreme drought conditions, high winds, and dense development in wildfire-prone zones,the fires caused catastrophic losses.
- Estimated economic impact: ~$250 billion
- Lives lost: 31
- Homes and structures destroyed: More than 16,000
Wildfires of this scale underscore the importance of parcel-level mapping, infrastructure visibility, and hazard overlays to identify high-risk areas and plan evacuations, access routes, and recovery logistics.
Hurricane Katrina – New Orleans, LA, USA – 2005
Interactive Map – Hurricane Katrina Aftermath in New Orleans’ Lower Ninth Ward – View Full Map
Hurricane Katrina remains one of the most studied disasters in modern U.S. history. Storm surge and levee failures led to widespread flooding across New Orleans, particularly in the Lower Ninth Ward.
- Estimated damage: $201 billion
- Lives lost: 1,833
- Residents displaced: Over 1 million
Katrina revealed thedevastating consequences of disconnected infrastructure data and limited situational awareness. Floodplain mapping, infrastructure inventories, and coordinated data access are now central to modern emergency planning frameworks.
Midwest U.S. Flooding – Central USA – 2025
Interactive Map – 100 Year and 500 Year Flood Plane of Frankfort, KY – View Full Map
In 2025, widespread flooding across the Midwest impacted multiple states after prolonged rainfall overwhelmed rivers and drainage systems.
- Estimated damage: ~$80 billion
- Lives lost: 25+
- Communities affected: Dozens across multiple states
Flood events like this highlight the need for integrated floodplain data, infrastructure maps, and parcel-level insight to anticipate impacts and coordinate response across jurisdictions.
Joplin, MO Tornado – Joplin, MO, USA – 2011
Interactive Map – Path of the Joplin, MO Tornado in 2011 – View Full Map
The Joplin tornado was one of the deadliest single tornadoes in U.S. history. An EF5 tornado cut directly through the city, destroying neighborhoods, hospitals, and schools.
- Estimated damage: $3.8 billion
- Lives lost: 161
- Homes destroyed: ~7,500
Rapid damage assessment and recovery depend on accurate base maps and field reporting tools that allow responders to document conditions quickly and consistently.
Hurricane Harvey – Houston, TX, 2017
Intereactive Map – USACE Maximum Flood Depths during Hurricane Harvey in 2017 – View Full Map
Hurricane Harvey brought unprecedented rainfall to the Houston region, causing catastrophic flooding well beyond traditional flood zones.
- Estimated damage: $160 billion
- Lives lost: 68
- Homes flooded: 150,000+
Harvey demonstrated that flood risk is not static. Communities need dynamic mapping tools that combine infrastructure and real-time data to understand changing conditions.
Turning Information Into Action Before the Next Emergency
Each of these disasters points to the same reality: preparedness depends on how well information is shared and used before an event occurs. Communities that have clear, connected data are better positioned to respond quickly, coordinate across teams, and support recovery when conditions change fast.
When critical information is accessible in one place and updated in real time, agencies can work from a common understanding of what is happening on the ground. This clarity reduces delays, improves communication, and helps teams focus on action rather than searching for information.
Tools like Smart Site Plan support this kind of preparedness by helping agencies:
- Bring maps, plans, and field information into a single, shared view
- Keep teams aligned with real-time updates and markups
- Support faster coordination during response and recovery
- Capture and retain on-the-ground knowledge for future planning
Preparedness is not about predicting the next disaster. It is about making sure communities have the tools and visibility they need to respond with confidence when it happens. Learn more!
Ready to Put This Into Practice?
See how Juno Maps applies to your specific industry and use case.