GIS Flood Map: Must-Have Tool for Flood Hazard Planning
Flooding remains the most frequent and expensive natural disaster in the United States. As flood risk grows in severity and complexity, communities must embrace dynamic, data-driven tools, and interactive GIS flood maps provide that modern advantage.
Flooding remains the most frequent and expensive natural disaster in the United States, threatening lives, infrastructure, and public safety across communities of all sizes. As flood risk grows in severity and complexity, local governments, tribal agencies, utilities, and emergency management teams can no longer rely on static maps or outdated flood zone reports. Instead, they must embrace dynamic, data-driven tools to plan ahead, respond quickly, and recover resiliently, and interactive GIS flood maps provide that modern advantage.
Key Takeaways
- Interactive GIS flood maps replace static Flood Insurance Rate Maps (FIRMs) with real-time, layered, and queryable flood hazard data
- Integration with FEMA's National Flood Hazard Layer (NFHL) ensures regulatory accuracy and NFIP compliance
- Layering infrastructure, demographics, and elevation data reveals true community exposure beyond mapped flood zones
- GIS flood maps strengthen HMGP and BRIC grant submissions by providing spatially documented risk evidence
- Cloud-based platforms enable cross-agency coordination without requiring local GIS infrastructure
- Real-time LOMC updates keep flood designations current, eliminating reliance on outdated static files
Why Traditional Flood Maps Are No Longer Enough
But the landscape has changed. Increased rainfall intensity, shifting climate patterns, rapid urbanization, sea-level rise, and aging stormwater systems mean flood risk is more dynamic and widespread than ever before. Today, many communities experience damaging flooding outside the boundaries of mapped flood zones, from surface runoff, flash floods, or drainage system failures that traditional FIRMs do not capture.
Relying solely on static maps often results in outdated information, poor coordination between agencies, and delayed response. The limitations become acute when planning depends on manual updates, siloed data, or unverified assumptions about real-world hazard conditions.
Communities now require a modern approach built on real-time data, geospatial analysis, and live collaboration:interactive GIS flood mapping.
What Are GIS Flood Maps?
GIS flood maps are interactive, data-driven maps that combine spatial data layers, such as elevation, hydrology, infrastructure, land use, utilities, environmental constraints, and demographic information, with regulatory flood hazard data and real-time field updates.
A GIS flood map is only as accurate as the data that feeds it. Integrating authoritative federal sources is critical, especially for regulatory and funding purposes. Tools built on the NFHL ensure mapping reflects the current effective flood hazard designations, including updates through Letters of Map Change (LOMC). This matters because regulatory flood zones, including Special Flood Hazard Areas (SFHAs) and designated coastal or riverine flood zones, directly determine insurance requirements, building restrictions, and funding eligibility under the National Flood Insurance Program (NFIP).
Interactive Map – 100 Year and 500 Year Flood Plane of Frankfort, KY – View Full Map
Through FEMA’s Flood Map Service Center (MSC), users can search any location, download effective FIRMs or FIRMettes, review preliminary flood maps, and track map changes relevant to property, county, or region. This ensures regulatory compliance and defensibility for permitting, planning, and mitigation decisions.
When an interactive GIS platform incorporates the latest NFHL updates from FEMA’s Flood Map Service Center, it can present the most current effective flood hazard designations, rather than relying on static PDFs or outdated map files. With GIS flood maps, stakeholders can zoom, query, annotate, overlay, share, and collaborate, transforming flood mapping from a static reference to a constantly evolving operational resource.
What is FEMA GIS data?
FEMA GIS data is official geospatial flood hazard information used to map flood zones and assess flood risk by location. It’s available online through the FEMA Flood Map Service Center on fema.gov and can be viewed in a web based mapping application or GIS platform.
How GIS Flood Mapping Works: Data, Layers, and Web Services
At the heart of modern flood mapping lies the integration of multiple data sources. A robust GIS application typically includes:
- Regulatory flood hazarddata from FEMA and the NFIP
- Elevation, hydrology, and topographic layers to model flood behavior
- Infrastructure and utility network data to identify asset vulnerability
- Demographic and communitydata to locate socially vulnerable populations
- Open data layers, including soil maps, land cover, environmental impacts, climate projections, or stormwater models
- Mobile-enabled inspection tools for field reporting and geo-tagged observations
This layered approach allows users to visualize risk comprehensively: from flood zones to utilities, from land use to vulnerable populations.
Unlike traditional flood maps, interactive GIS tools operate through web-based services, accessible from standard browsers or devices, eliminating dependency on localized hardware or specialized technical staff. Real-time data sharing ensures that every stakeholder is working from the same current information.
Because the mapping is digital and dynamic, updates, whether from regulatory changes, new studies, or field observations, can propagate quickly across all users, ensuring everyone sees the same current flood risk data.
How GIS Flood Mapping Enhances Preparedness, Response, and Recovery
Interactive GIS flood maps provide that full-spectrum capability. By integrating authoritative FEMA flood hazard data with local infrastructure and real-time field insight, they help governments and utilities move from reactive decision-making to proactive planning. When all stakeholders are working from the same accurate, up-to-date flood risk data, communities can identify vulnerabilities sooner, coordinate faster, and rebuild more efficiently.
Here’s how GIS flood mapping strengthens preparedness, emergency response, and long-term recovery.
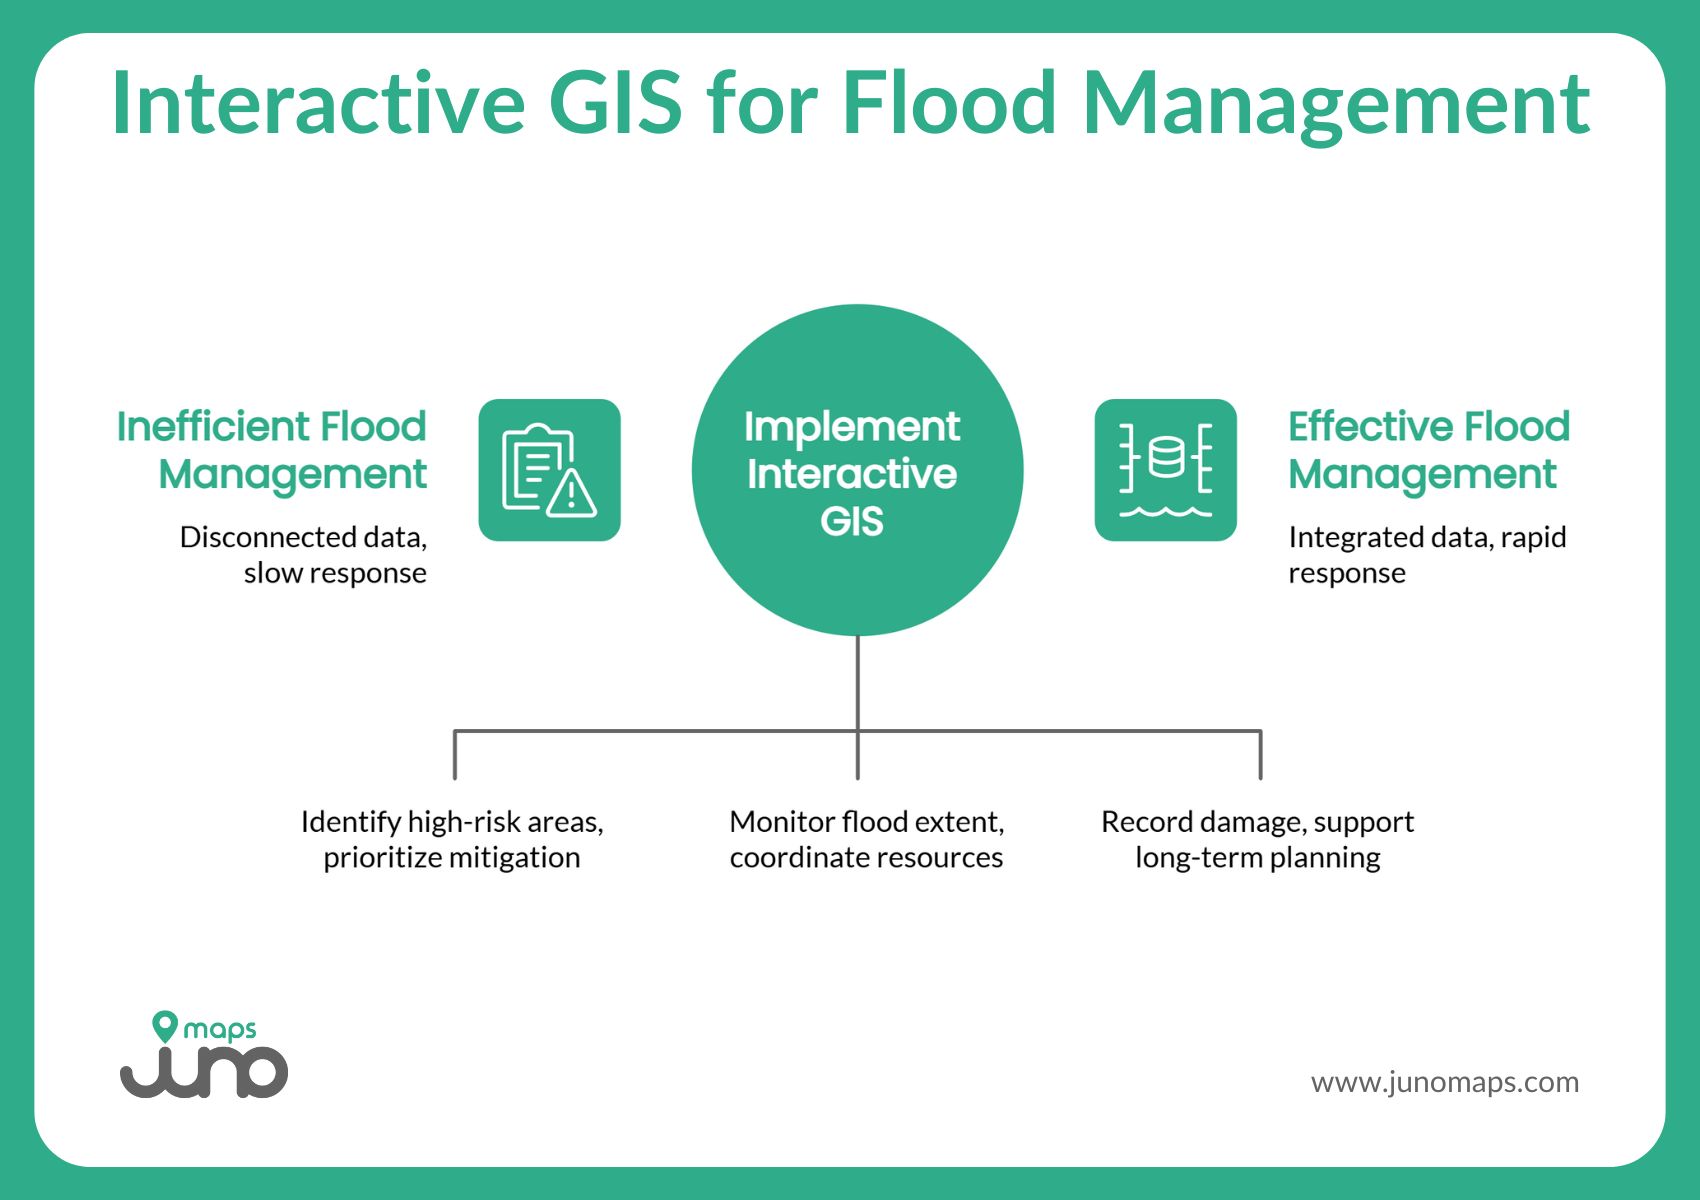
Preparedness and Hazard Mitigation Planning
Interactive GIS flood maps allow planners and public works departments to combine regulatory flood zones with local infrastructure, population centers, and critical assets. This makes it possible to:
- Identify high-risk areas such as utilities in coastal or high-exposure regions
- Prioritize mitigation strategies based on measurable flood risk
- Strengthen grant submissions (BRIC / HMGP) and hazard mitigation plans
- Build defensible documentation for compliance with NFIP, floodplain management standards, and federal hazard mitigation regulations under DMA 2000 / 44 CFR Part 201
Because NFHL data is integrated, the maps reflect current effective zoning, a must for compliance with federal requirements under NFIP, floodplain ordinances, and hazard mitigation standards.
Emergency Response and Real-Time Risk Management
During a flood event, an interactive tool can become a mission-critical resource:
- Emergency management teams can monitor flood extent and risk zones via web or mobile GIS viewers
- Field crews can report damage, closures, and conditions through geo-tagged forms tied to map locations
- Utilities, public works, and first responders can coordinate instantly using shared map intelligence
That reduces confusion, speeds up response, and helps direct resources where they are most needed.
What is a FEMA flooding map?
A FEMA flooding map, or Flood Insurance Rate Map (FIRM), shows regulatory flood zones for property and county areas. It’s used by community officials, lenders, and emergency teams and is accessible on msc.fema.gov for review and action.
Recovery, Documentation, and Resilience Building
Once floodwaters recede, interactive GIS flood maps remain valuable:
- Provide a defensible record of hazard zones, infrastructure damage, and affected areas, critical for FEMA reimbursements or insurance claims under NFIP.
- Support long-term planning: overlay flood hazard zones with future development plans, infrastructure improvement projects, or green-infrastructure strategies.
- Reduce the risk of repeated damage by helping communities adopt improved land-use, zoning, and mitigation measures based on spatial evidence.
With these capabilities, a GIS flood map product becomes more than a static layer: it becomes a living, collaborative flood risk management platform.
Juno Maps and the Role of Modern Geospatial Platforms in Flood Preparedness
While FEMA and NFIP data provide the regulatory and authoritative baseline, many jurisdictions find that day-to-day planning, multi-agency collaboration, and real-world field operations demand more flexible, user-friendly geospatial tools.
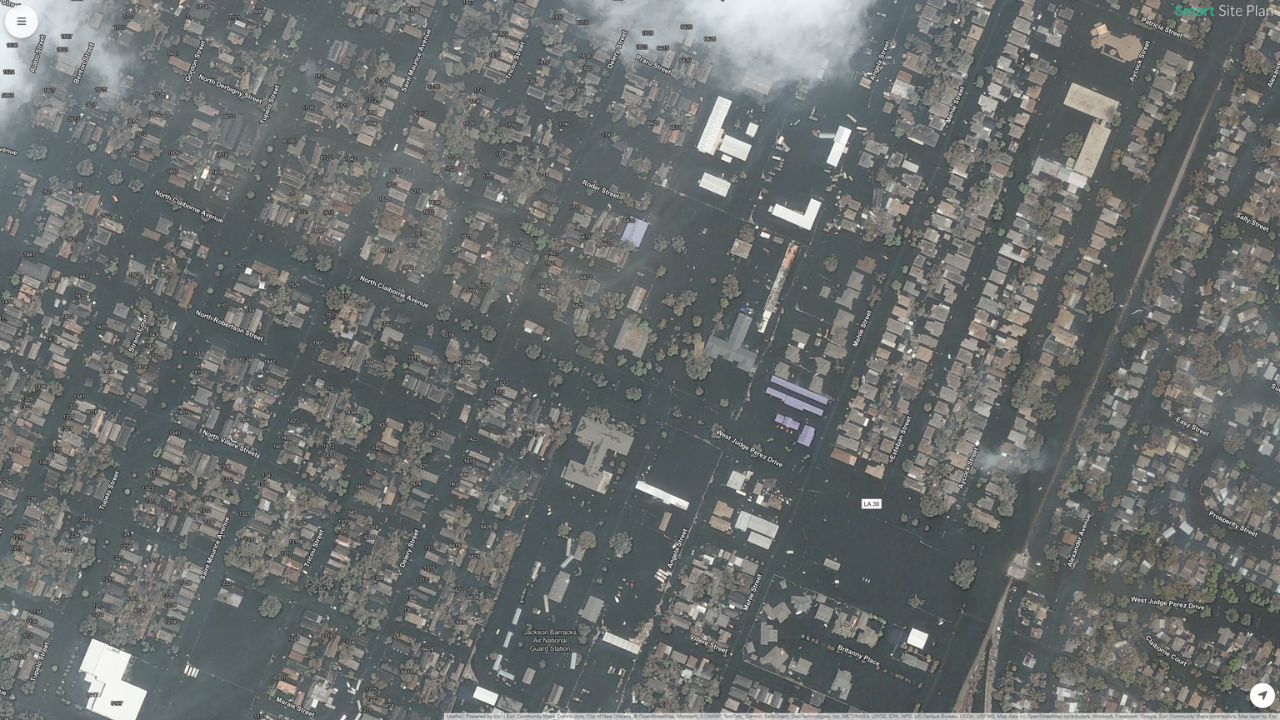
That’s where modern products such as Smart Site Plan by Juno Maps become crucial. Tools such as Smart Site Plan can integrate open datasets and regulatory flood hazard information into a unified mapping environment, depending on the data supplied or connected by the jurisdiction.
With Smart Site Plan:
- Stakeholders across government, utilities, and public works can view, edit, and collaborate on flood maps in real time
- Regulatory data, including NFHL flood risk layers, flood zone designations, and FEMA flood map information, becomes a living, interactive resource, not a static PDF
- Field teams can capture geo-tagged inspections, damage reports, and asset conditions straight from the map, supporting compliance, documentation, and recovery
- Project planning, hazard mitigation preparation, infrastructure maintenance, and grant application efforts benefit from a unified geospatial database accessible from anywhere
For communities, utility providers, and emergency management agencies committed to resilience, integrating GIS flood mapping tools with authoritative FEMA data ensures compliance and makes flood preparedness, response, and recovery smarter, faster, and more defensible.
What agency determines flood zones?
The Federal Emergency Management Agency (FEMA) is the agency that designates and updates flood zones using FIRMs, FIRM databases, and Letters of Map Change (LOMC), which allow updates or appeal requests.
Protect Your Community. Transform Your Flood Mapping Strategy with Smart Site Plan
Flood risk is not static. As environmental conditions shift and hazard exposure grows, communities need tools that can evolve, adapt, and provide clarity. Interactive GIS flood maps deliver that clarity. They combine authoritative flood hazard data, geospatial context, infrastructure overlays, and real-world collaboration into one living resource.
By pairing authoritative FEMA data (NFHL, FIRMs) with modern geospatial tools like Smart Site Plan, communities can transform flood maps from static documents into dynamic, actionable maps of risk and resilience.
If you are responsible for hazard mitigation, floodplain management, infrastructure planning, or emergency response, now is the time to evaluate your mapping tools and consider a modern GIS approach like Smart Site Plan. The future of flood preparedness is interactive, accessible, and data-driven. Read more about it.
Ready to Put This Into Practice?
See how Juno Maps applies to your specific industry and use case.